Softwares and data reduction
In this page, we collect some resources that can be useful for the data reduction of NIRSpec IFS data. We also present some softwares developped by members of the GA-NIFS team for the analysis of NIRSpec IFS data.
- ● Data reduction of JWST/NIRSpec IFS data
- ● PSF characterization
- ● R100 wavelength calibration
- ● Wiggles removal
- ● QubeSpec emission line fitting tool
Improvements to the data reduction of JWST/NIRSpec IFS data
We developped a few improvements with respect to the standard JWST data-reduction pipeline.
The additional steps and corrections in the pipeline code to improve the quality of the data
reduction are described in Section 3 in
Perna et al. (2023)
and Section 1.1 in D'Eugenio et al. (2024).
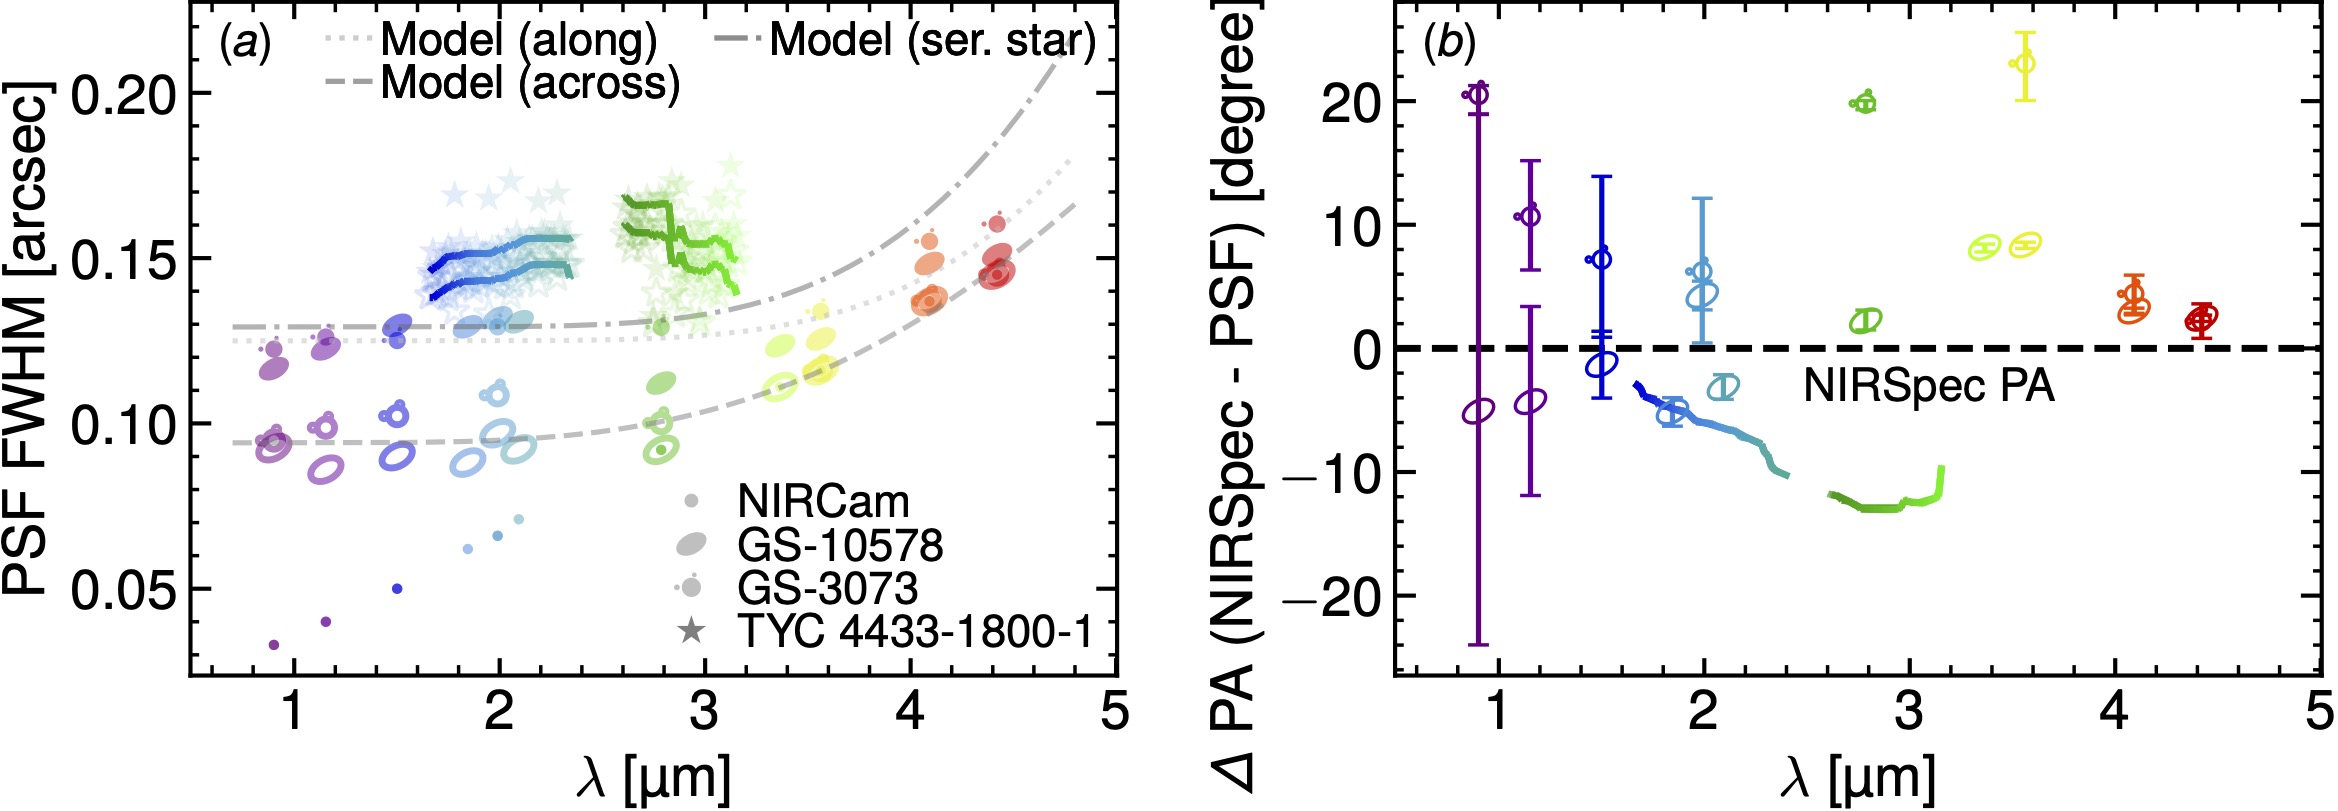
Characterization of the Point-Spread Function of JWST/NIRSpec IFS data
In D'Eugenio et al. (2024),
we provide three independent measurements of the shape and size of the NIRSpec/IFS PSF. The first measurement uses observations
of a standard star with the g235h/f170lp grating/filter combination. The second method uses a serendipitous star inside the
NIRSpec/IFS field of view of GS-10578. The third method uses NIRCam imaging from the JADES and JEMS surveys (for which the PSF
is well understood) to infer the NIRSpec/IFS PSF.
For further details, see section 1.2 of the Methods in
D'Eugenio et al. (2024).
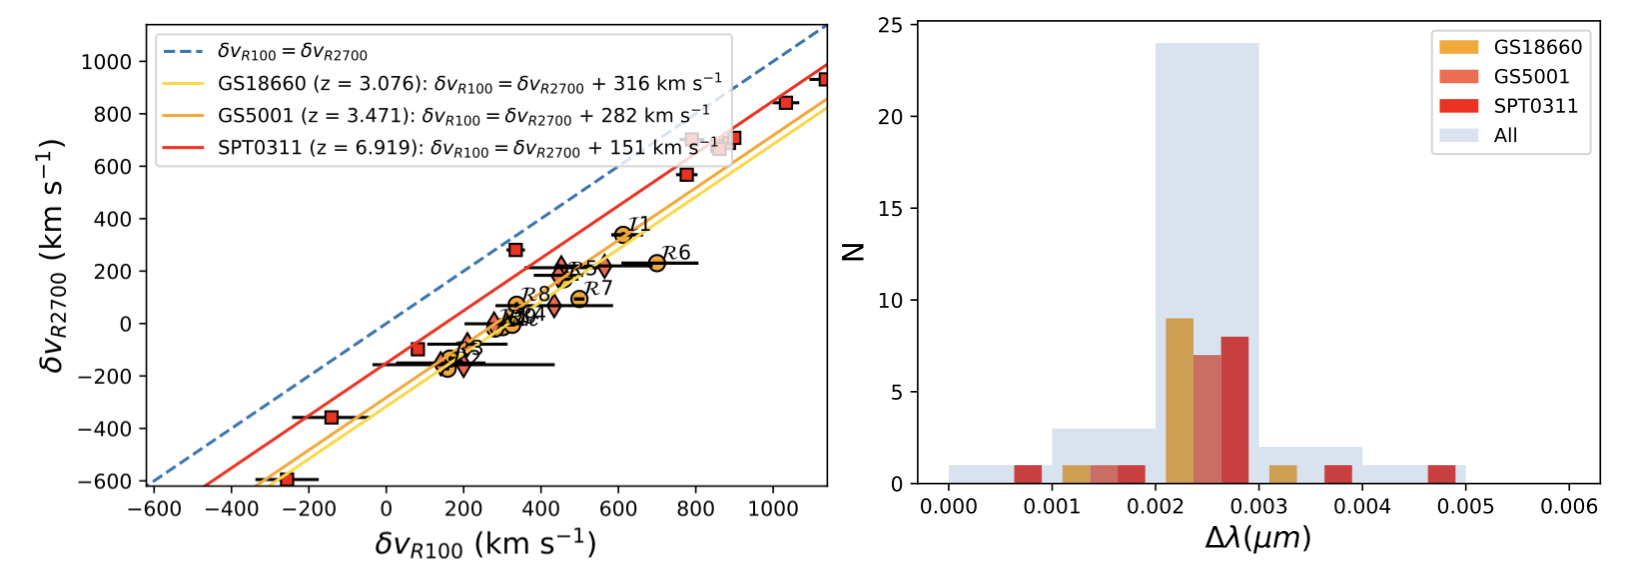
Wavelength calibration of R100 data
It has been noted that there is a systematic wavelength calibration offset which affects the R100 mode in NIRSpec IFS observations.
In Perna et al. (2026), we investigate the wavelength calibration accuracy of the NIRSpec R100 data, by comparing the observed velocities of
emission lines in the low-resolution R100 spectra with those obtained from the high-resolution R2700 data for the same spatial regions
in three (small) groups of galaxies.We derive an empirical calibration to correct the wavelength of the R100 data.
We found a systematic offset of Δλ = 24 ± 5 A. We recommend applying this correction when using R100 data
for redshift measurements in the absence of an absolute wavelength reference.
The details are reported in appendix B of Perna et al. (2026).
Software for the removal of wiggles in JWST/NIRSpec data (M. Perna)
The spatial undersampling in the NIRSpec IFS may result in apparent wiggles in the single-spaxel
spectra close to the position of bright point sources, such as stars and QSOs. There is currently
no correction in the pipeline for these artefacts; large spatial extraction regions are hence required
to reduce the amplitude of the effect in extracted 1-D spectra
(see Perna et al. 2023;
Law et al. 2023).
There are situations where a point source overlaps with extended emission, thus requiring to disentangle
the flux from both sources, for instance, in studies of QSO hosts and their close environment.
We developped a code that allows to subtract the spurious wiggles at single-spaxel level. The code is written
in python and it is publicly available on github.
Link to github
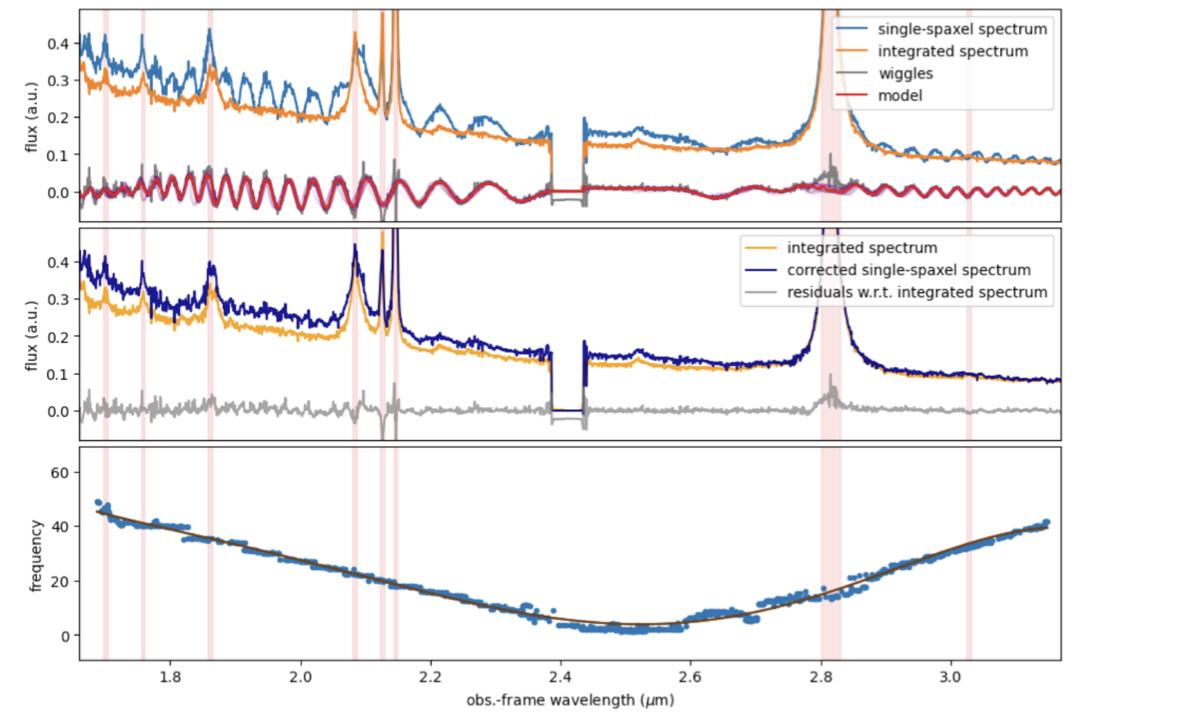
Top panel: integrated LBQS 0302−0019spectrum (orange curve), single-spaxel spectrum (blue), and wiggles (grey). The red curve represents the best-fit model of the wiggles.
Central panel: Single-spaxel spectrum after the correction for the wiggles (dark blue), in comparison with the integrated spectrum (orange); the grey curve represents the new residuals with respect to the integrated spectrum.
Bottom panel: Best parameter for the frequency of the sinusoidal functions used to model the wiggles (blue points).
QubeSpec: A powerful python package for JWST/NIRSpec IFU data analysis (J. Scholtz)
QubeSpec is a simple but powerful python package to fit optical astronomical spectra and more importantly analysing IFS cube
from JWST/NIRSpec, JWST/MIRI, VLT/KMOS and VLT/SINFONI. The code has built models for fitting Halpha, [OIII], Hbeta, [SII] and
[NII] of galaxies, galaxies with outflows, Type-1 AGN and Quasars.
Link to github